
WASHINGTON – The Migration Policy Institute (MPI) today released its latest socio-demographic data profiles of unauthorized immigrants for the United States, 41 states and the District of Columbia, as well as the 130 counties with the largest unauthorized populations.
The profiles, based on MPI’s unique methodology to assign legal status onto the U.S. Census Bureau’s American Community Survey (ACS), offer 2019 data for areas ranging from population size, countries of origin and years of U.S. residence to educational enrollment and attainment, home ownership, top industries of employment, health insurance coverage and poverty levels. The profiles also include estimates on age, gender, parental and marital status, top languages spoken and labor force participation for the nation’s estimated 11 million unauthorized immigrants.
A related interactive map allows users to see the top U.S. destinations for unauthorized immigrants by top country and region of origin.
Mexicans continued to account for just under half of all unauthorized immigrants in the United States—48 percent in 2019. Mexico and Central America, combined, remain by far the greatest source region for unauthorized immigrants—with 67 percent of the total—while Asia ranks second with 15 percent. South Americans represent a relatively small but rapidly growing group, at 8 percent of the overall unauthorized population, with numbers increasing particularly for Venezuelans.
South American unauthorized immigrants are highly concentrated in Florida—particularly the South Florida counties of Miami-Dade, Broward and Palm Beach—as well as in the Northeast: New York City, Connecticut and Massachusetts. Established South American communities in these locations may be growing rapidly given the increased number of encounters of South Americans at the U.S.-Mexico border since 2019.
Aside from these newer, expanding groups, the unauthorized population is generally well settled, with 63 percent having resided in the United States for 10 years or more, including 22 percent who have 20 years or more of U.S. residence.
Even as unauthorized immigrants have become more dispersed across the country, they remain concentrated in traditional destination states. In 2019, one-quarter of the unauthorized population lived in California, and nearly half lived in either California, Texas or New York. At the local level, one-fifth of them resided in the counties where four major cities—Los Angeles, New York, Houston and Chicago—are located.
About 1.3 million unauthorized immigrants were married to U.S. citizens and another 654,000 were married to lawful permanent residents (LPRs) in 2019. At the same time, 4.7 million U.S.-citizen children had at least one unauthorized immigrant parent, as did 61,000 LPR or nonimmigrant children.
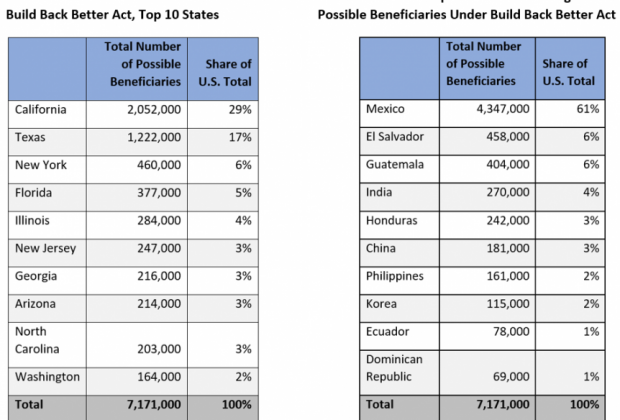
Beyond using its methodology to generate data profiles, MPI at times estimates the scope of proposed legislation that touches on facets of the unauthorized immigrant population. MPI researchers estimate that immigration-related provisions within the Build Back Better Act that passed the House on Nov. 19 and is now before the Senate could provide work authorization and protection from deportation to nearly 7.2 million unauthorized immigrants who have been in the United States as of January 1, 2011.

Among the nearly 7.2 million unauthorized immigrants who MPI estimates could benefit under the House-passed legislation are 2.6 million DREAMers—people who entered the United States before age 18.
For the unauthorized data profiles at U.S., state and county levels, visit: www.migrationpolicy.org/programs/data-hub/unauthorized-immigrant-population-profiles.
For a map of top destinations for unauthorized immigrants by country or region of origin, visit: www.migrationpolicy.org/programs/data-hub/charts/unauthorized-immigrant-populations-country-and-region-top-state-and-county.
For a data tool on the DACA eligible and status holders, check out: www.migrationpolicy.org/programs/data-hub/deferred-action-childhood-arrivals-daca-profiles.