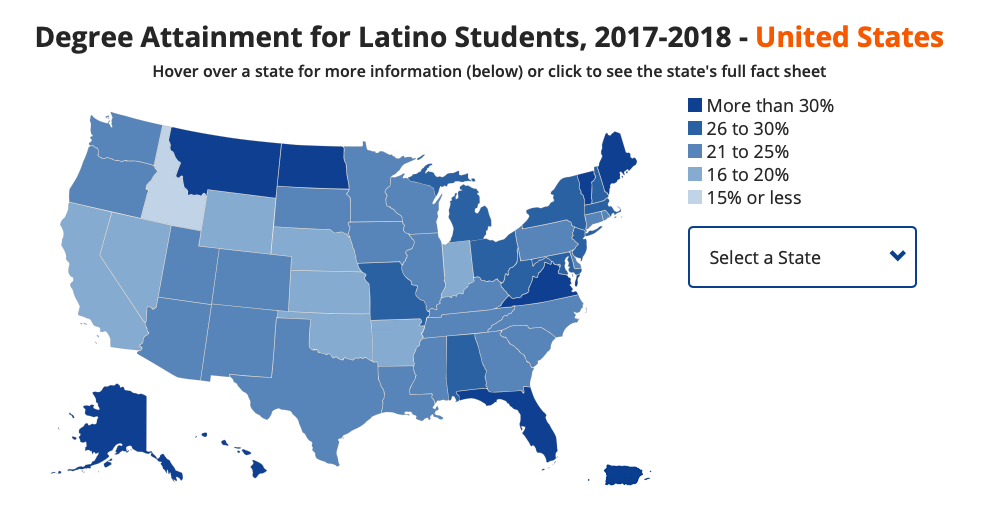
Does Latino college completion vary by location?
Nationally, Latino student enrollment and degree completion continues to increase. However, to reach the Latino degree attainment goal of 6.2 million degrees by 2030 requires a tactical plan for Latino college completion. This plan should include: closing equity gaps in degree completion, and accelerating, not just increasing, Latinos’ degree attainment.
Degree Attainment for Latino Students (2017-2018), United States
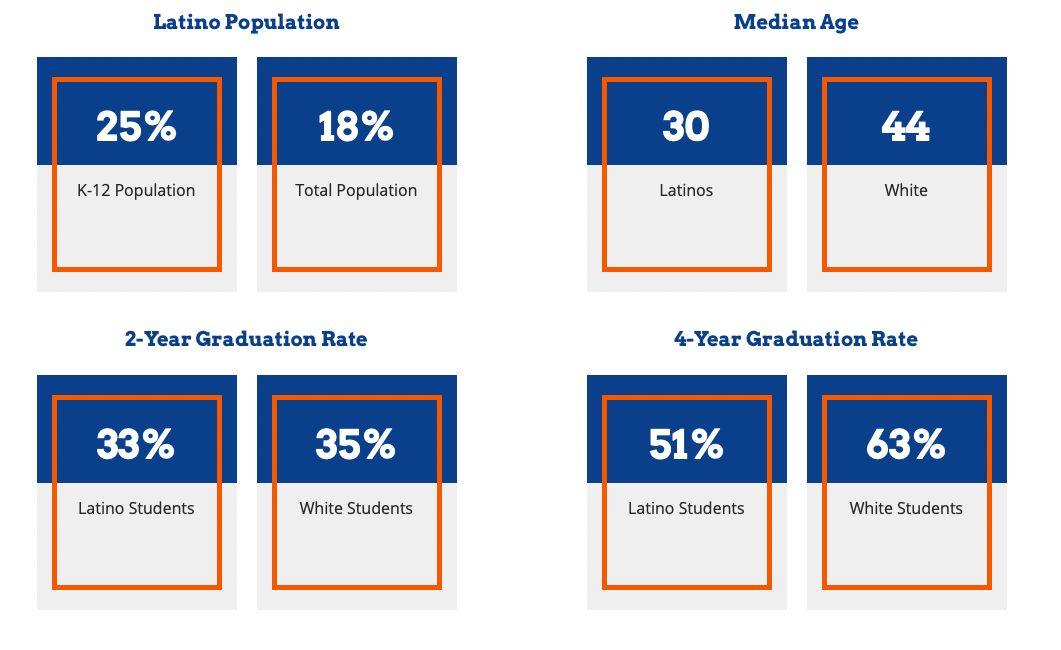
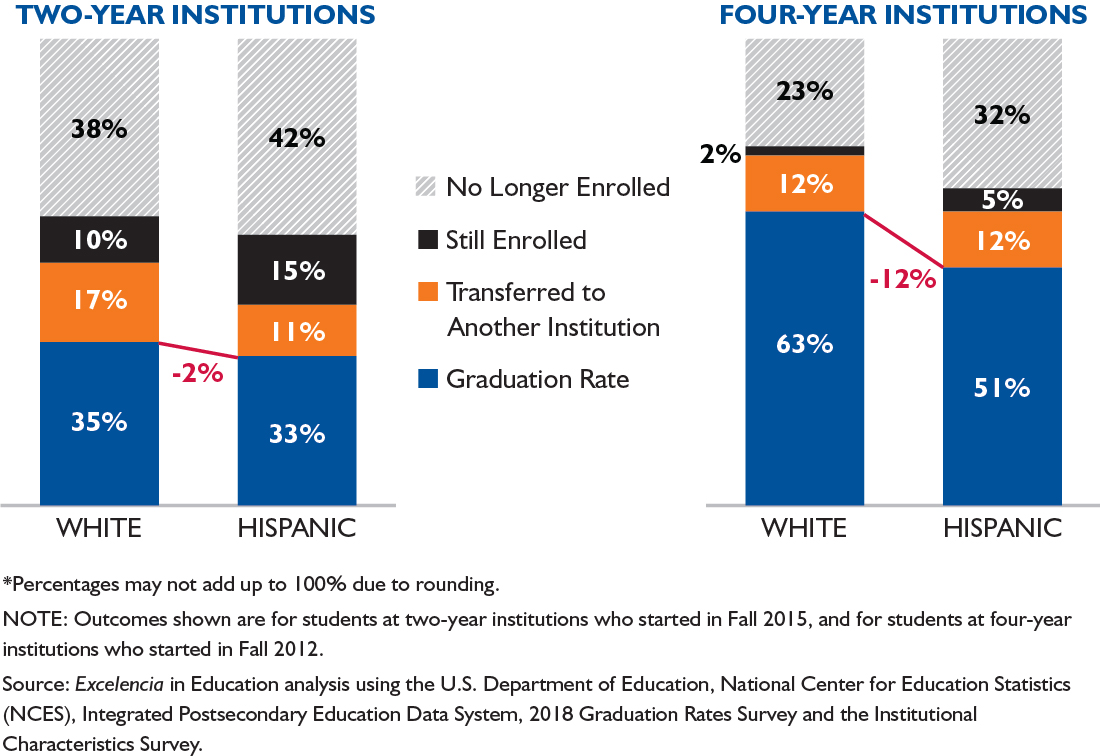
Degree Outcomes
At two-year institutions, Hispanics' graduation rate was 2%-points lower than that of their White non-Hispanic peers in the United States.
At four-year institutions, Hispanics' graduation rate was 12%-points lower than that of their White non-Hispanic peers in the Unites States.
Top National Institutions
Enrolling: Top Institutions (Hispanic Undergraduates) Nationally, 2018-2019
| RANK | INSTITUTION | STATE | SECTOR | GRAND TOTAL | HISPANIC TOTAL | % HISPANIC |
|---|---|---|---|---|---|---|
| 1 | Miami Dade College | FL | Public, 4-year or above | 54,973 | 38,213 | 70% |
| 2 | Florida International University | FL | Public, 4-year or above | 48,818 | 32,877 | 67% |
| 3 | South Texas College | TX | Public, 4-year or above | 31,949 | 30,419 | 95% |
| 4 | Lone Star College System | TX | Public, 2-year | 73,499 | 27,925 | 38% |
| 5 | El Paso Community College | TX | Public, 2-year | 28,819 | 24,601 | 85% |
Associates Degrees: Top Institutions Awarding to Hispanics Nationally, 2017-2018
| RANK | INSTITUTION | STATE | SECTOR | GRAND TOTAL | HISPANIC TOTAL | % HISPANIC |
|---|---|---|---|---|---|---|
| 1 | Miami Dade College | FL | Public, 4-year or above | 9,594 | 6,670 | 70% |
| 2 | South Texas College | TX | Public, 4-year or above | 4,112 | 3,923 | 95% |
| 3 | El Paso Community College | TX | Public, 2-year | 3,438 | 2,975 | 87% |
| 4 | Lone Star College System | TX | Public, 2-year | 7,552 | 2,654 | 35% |
| 5 | Valencia College | FL | Public, 4-year or above | 7,864 | 2,574 | 33% |
Bachelors Degrees: Top Institutions Awarding to Hispanics Nationally, 2017-2018
| RANK | INSTITUTION | STATE | SECTOR | GRAND TOTAL | HISPANIC TOTAL | % HISPANIC |
|---|---|---|---|---|---|---|
| 1 | Florida International University | FL | Public, 4-year or above | 10,261 | 6,764 | 66% |
| 2 | California State University-Fullerton | CA | Public, 4-year or above | 9,038 | 3,660 | 40% |
| 3 | The University of Texas Rio Grande Valley | TX | Public, 4-year or above | 4,046 | 3,618 | 89% |
| 4 | California State University-Northridge | CA | Public, 4-year or above | 8,806 | 3,573 | 41% |
| 5 | California State University-Long Beach | CA | Public, 4-year or above | 8,615 | 3,417 | 40% |
Sources
Excelencia in Education. (2020). Ensuring America’s Future: Benchmarking Latino College Completion to 2030. Excelencia in Education. Washington, D.C.
US. Census Bureau, Projected Race and Hispanic Origin: Main Projections Series for the United States, 2017-2060.
United Nations, Department of Economic and Social Affairs, Population Division. World Population Prospects: The 2019 Revision. (Medium variant).
U.S. Census Bureau, Annual Estimates of the Resident Population by Hispanic Origin for the United States and States: April 1, 2010 to July 1, 2018.
U.S. Census Bureau, 2018 American Community Survey 1-Year Estimates.
U.S. Census Bureau, 2014-2018 American Community Survey 5-Year Estimates.
Excelencia in Education analysis using U.S. Department of Education, National Center for Education Statistics (NCES), Integrated Postsecondary Education Data System (IPEDS), 2018 Fall Enrollment, Graduation Rates Survey and Institutional Characteristics Survey.